

Mardoqueo Arteaga, P.h. D.

Mardoqueo Arteaga is an applied economist at LinkedIn, where he provides marketing science strategy and support to major enterprise clients. He uses member data and behavior to find insights on how best to shape LinkedIn's advertising business, utilizing causal inference and machine learning.
Before tech, he was in the Economic and Statistical Consulting group at KPMG, where he served as a project lead to clients in healthcare, telecommunications, state agencies, financial services, and transfer pricing. His work spanned causal inference for labor programs, probabilistic simulation for complex assets, and research on policy changes.
Mardoqueo received his PhD in Economics, specialty in belief formation, from Fordham University and previously worked as a visiting associate researcher at the Central Bank of Chile. His research in information economics and the impact of monetary policy announcements on household behavior has been published in the Economics Bulletin and Journal of Economic Analysis. Prior to graduate studies, he worked as a risk analyst at TIAA-CREF and was the valedictorian at Montclair State University. Outside of work, Mardoqueo is a published poet, avid reader, and rescue dog dad.
Press & Engagements
-

Beyond the Resume: LinkedIn Career Panel Discussion
PANELIST: Grounded curiosity drives confident, integrated professional growth.
-
IBJ Podcast
PODCAST: Early career decisions, personal background, and research.
-

HigherEd+ Exiting Academia
INTERVIEW: Highlighting successful transitions from academia to industry.
-
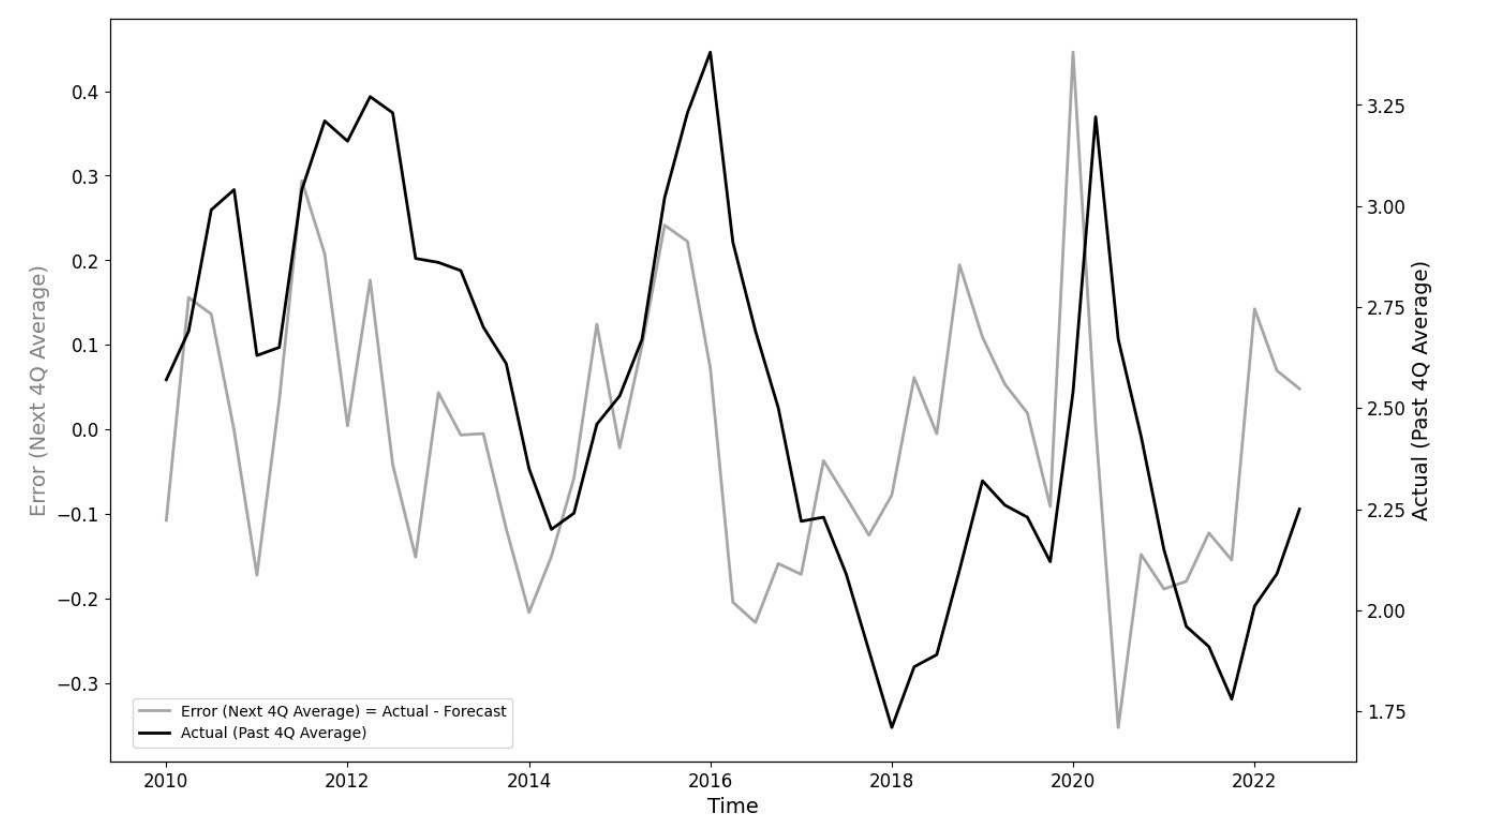
Economics Bulletin
RESEARCH ARTICLE: Credit spread expectations and key macroeconomic indicators.