

How Economic Standards Survive Political Interference
by Kent O. Bhupathi
Ten days running is my tally of hearing some variation of the same uneasy question: “Will we be able to trust the numbers coming out of Washington?”
And these aren't conspiracy theorists or online agitators. They are fellow economists, investors, and business leaders. You know… sensible, data-driven people… who built careers on the assumption that official statistics were, if not perfect, at least honest.
Now that trust is starting to fray.
When government-reported metrics like inflation, GDP, or unemployment begin to sound too clean, too convenient, or too contradictory, the impact goes beyond economic modeling. The unease spills into boardrooms and newsrooms. Financial forecasts lose their foundation. People begin to wonder not just what the economy is doing, but whether they can believe anything they’re being told.
I’ve felt that uncertainty myself. And I’ve heard it in the voices of colleagues, clients, and friends. There is concern, frustration, and a fear that something foundational is slipping away.
But here’s what I say in return: Don’t despair.

This isn’t the first time numbers have been bent to political will. And it won’t be the last. What matters now is not whether data can be distorted. We know it can. What matters is whether we remember how to fight back.
For those of us trained in statistical and economic methods, this is a familiar battle. History is full of cases where official data lost its moorings, but the truth did not stay buried for long. With discipline, transparency, and a commitment to evidence, the closest thing to truth can still be found. Not in headlines, but in honest analysis.
Why Trust Fails: A Global Pattern
The doubt many Americans feel today mirrors patterns seen elsewhere. Argentina underreported inflation for years. In response, Alberto Cavallo and his MIT team began scraping prices from online retailers to create an independent index. Their results showed inflation nearly three times higher than what the government claimed between 2007 and 2011. It was one of the earliest and clearest demonstrations that official numbers can be challenged using transparent methods and modern tools.
India revised its GDP calculation methodology in 2015. The new numbers looked rosy, but economist Arvind Subramanian, using electricity consumption, vehicle sales, and credit growth, found that the real growth rate was likely two percentage points lower than reported.
China’s GDP growth from 2015 to 2019 hovered implausibly between 6.2% and 7.0% for 16 straight quarters. That kind of stability defies economic logic. Underneath that polished surface, other indicators like industrial output showed much wider fluctuations. Analysts concluded that certain sectors were being adjusted to smooth out the overall numbers.
Greece famously hid the scale of its budget deficit in the early 2000s, triggering a debt crisis that rippled across the European Union. Only after Eurostat and external auditors were given more authority did the numbers begin to reflect reality.
These examples differ in scope and context, but they share a common thread. When trust erodes, it usually begins with a series of numbers that no longer add up.
Fortunately, there are ways to spot when the story doesn’t align with the statistics.
Four Tools That Can Help Reclaim the Truth
If economic trust is eroding, then the way forward is through methods designed to detect manipulation, not by giving in to cynicism.
Below are four powerful tools used by independent economists, researchers, and statistical agencies around the world:
1. Historical Benchmark Comparisons
One of the simplest but most effective methods is to compare new data against long-term trends. If inflation or GDP figures suddenly show patterns that break from historical norms, analysts pay attention. For example, volatility within a certain range is expected. When that volatility vanishes without explanation, as in China’s GDP case, the numbers deserve scrutiny.
Another benchmark tool is Benford’s Law, a statistical pattern found in naturally occurring datasets. When applied to economic data, it can highlight anomalies in reported numbers. Significant deviation from the expected digit distribution may signal tampering or fabrication. Benford’s Law has been applied not only to GDP figures but also to pandemic case counts and inflation data.
2. Econometric Bias Detection
Economists use what are called structural break tests and rolling regressions to detect when the behavior of a data series changes abruptly. For instance, if unemployment is suddenly unresponsive to changes in consumer demand or industrial output, that could signal a measurement issue.
India’s GDP after 2011 is a good example. Once the country changed its statistical method, the relationship between GDP and its traditional predictors shifted. Independent studies using econometric models confirmed a likely overstatement of growth.
These tools are powerful because they can isolate deviations not visible to the naked eye. When outliers or structural breaks coincide with political events, the signal becomes even harder to ignore.
3. Nowcasting with External Predictors
Nowcasting models draw on independent, high-frequency data (for example satellite imagery, electricity consumption or online prices) to estimate economic activity in real time. This strategy proved instrumental in uncovering Argentina’s hidden inflation and has since been applied in countries where official data face credibility concerns.
Night-light data, for example, has been used to estimate GDP growth in authoritarian regimes. In several cases, these external estimates revealed lower growth than what governments reported, especially near election years. In Turkey, independent researchers used market-based inflation tracking to reveal that the true inflation rate was twice the official figure.
These models do not replace official data, but they offer a parallel narrative. When the two diverge dramatically, that divergence itself is evidence.
4. Reconciliation with National Accounts Identities
Macroeconomic data must obey arithmetic relationships! GDP, for example, can be measured by output, income, or expenditure. And those measures should certainly align. When they don’t, something is off. That’s just math.
Greece's crisis exposed this clearly. Fiscal deficits did not reconcile with debt levels. Trade data didn’t match partner country records. Eventually, these inconsistencies triggered a full-blown audit and led to international oversight.
In China, analysts have pointed out that the sum of provincial GDPs routinely exceeded the national total. More recently, when industrial production dipped, the services sector conveniently surged to keep overall GDP steady. That kind of compensation might pass casual inspection, but not the eyes of a trained economist.
Why This Matters Now
A lack of trust in economic reporting is corrosive. It destabilizes markets, erodes public discourse, and clouds policy debates. For financial professionals, it raises the risk of making decisions based on distorted inputs. For journalists, it complicates the task of holding institutions accountable.
But the lesson from Argentina, India, China, and Greece is this: While institutions can falter, truth has tools. And people have choices.
Independent researchers, transparent methodologies, and cross-validated data sources form the backbone of what might be called a second opinion economy. These are the checks and balances that keep the broader system honest.
There is no perfect dataset. Every metric ever comes with its caveats. But integrity is less about perfection and more about discipline. About making sure that when numbers change, they change for reasons rooted in economics, not politics.
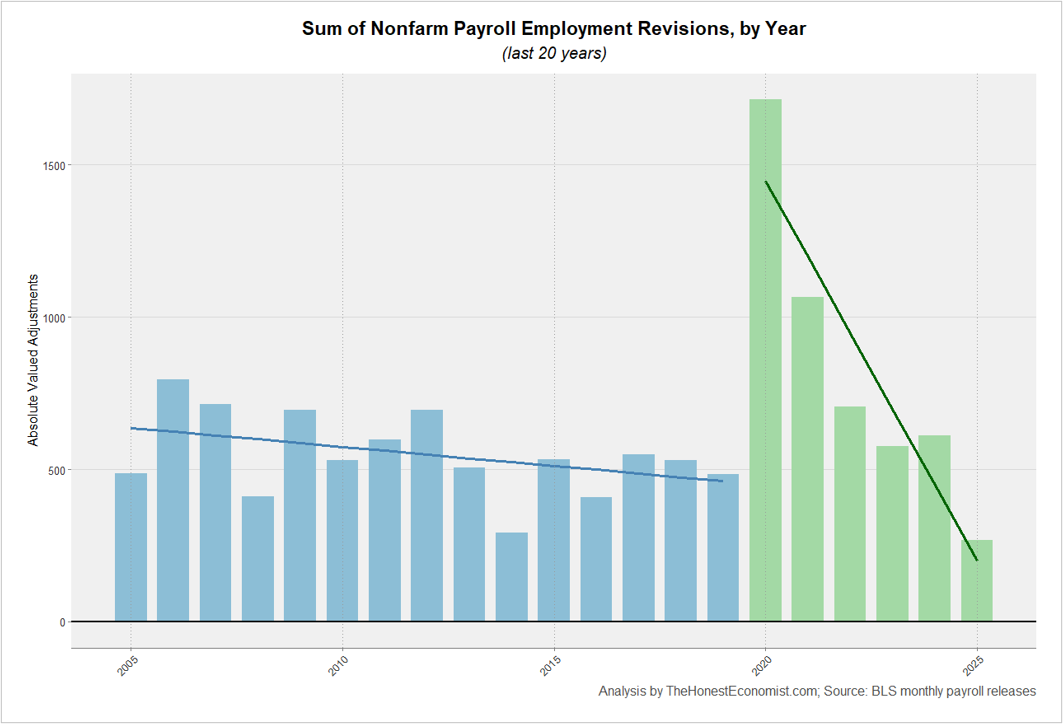
The chart highlights a striking shift in the scale of U.S. nonfarm payroll employment revisions over the past two decades (since this is what caused all the ruckus). Prior to 2020, revision magnitudes were relatively modest and gradually declining, reflecting the BLS's ability to refine early payroll estimates with additional incoming data in a relatively stable economic environment. This consistency fostered confidence in the reliability of the initial monthly job reports, with annual revisions typically ranging between 400,000 and 800,000 jobs.
That pattern changed dramatically in the wake of COVID-19. Revisions surged to an unprecedented level in 2020, before falling steadily in subsequent years. This elevated volatility reflects the immense challenge of capturing labor market dynamics amid sudden closures, policy interventions, and delayed employer responses. Yet, the pronounced downward trend in revision size since that peak suggests a return to statistical normalization. While current levels remain above the pre-pandemic baseline, the trajectory points to what can only be a recovery in the precision and predictability of monthly employment data.
A Call to Action for the Statistical Community
This moment demands vigilance and transparency. Economists and statisticians should continue to interrogate methods, publish validation protocols, and build models that hold up when official series begin to wobble. Business leaders and journalists should seek out those doing the hard (and often thankless) work of cross-checking and independent forecasting. They may not be the loudest voices, yet they are indispensable.
For readers who feel disillusioned, your concern is understandable. But, you are not powerless! Calls to your representative do a lot more than you realize. The truth is resilient, although it takes work to uncover.
The question, "Will we still be able to trust the numbers coming out of Washington?" is timely and vital, yet not new and not insurmountable.
History shows that economic data can be distorted, and also that it can be recovered, revalidated and reclaimed. What is required is not blind faith, but active participation from those who care about measurement and merit.
Rather than surrender to doubt, we need to sharpen our tools and widen the circle of those willing to use them.
Sources:
Cavallo, Alberto. “Online and Official Price Indexes: Measuring Argentina’s Inflation.” Journal of Monetary Economics 60, no. 2 (2013): 152–165. https://www.hbs.edu/ris/Publication%20Files/Cavallo_Alberto_Online%20and%20Official%20Price%20Indexes%20Measuring%20Argentinas%20Inflation_600c0e8f-cc57-430d-b869-a650dda2b290.pdf.
“Don’t Lie to Me, Argentina.” The Economist, June 20, 2014. https://www.economist.com/leaders/2014/06/20/dont-lie-to-me-argentina.
Frey, Bruno S., Louis Moser, and Sandro Bieri. Governments Manipulate Official Statistics: Institutions Matter. Zurich: Center for Research in Economics, Management and the Arts (CREMA), October 18, 2022. https://www.crema-research.ch/wp-content/uploads/2022/11/Governments-Manipulate-Official-Statistics.pdf.
Gonzalez-Garcia, Jesus, and Gonzalo Pastor. Benford’s Law and Macroeconomic Data Quality. IMF Working Paper WP/09/10. Washington, DC: International Monetary Fund, January 2009. https://www.imf.org/external/pubs/ft/wp/2009/wp0910.pdf.
International Monetary Fund. Data Quality Assessment Framework (DQAF) for National Accounts Statistics. Statistics Department. Washington, DC: International Monetary Fund, May 2012. https://dsbb.imf.org/content/pdfs/dqrs_nag.pdf.
Nag, Anirban. “India Refutes ‘Unfounded’ Criticism about Government’s GDP Data.” Bloomberg, January 31, 2020. https://www.bloomberg.com/news/articles/2020-01-31/india-refutes-unfounded-criticism-about-government-s-gdp-data.
Rassier, Dylan G. “The Role of Profits and Income in the Statistical Discrepancy.” Survey of Current Business, February 2012. https://apps.bea.gov/scb/pdf/2012/02%20February/0212_statisticaldiscrepancy.pdf.
Shalal, Andrea, and Davide Barbuscia. “Easy to Lose, Hard to Restore: US Data Trust on the Line.” Reuters. Last modified August 6, 2025. https://www.reuters.com/world/us/easy-lose-hard-restore-us-data-trust-line-2025-08-05/.
Wright, Logan, and Daniel H. Rosen. “China’s GDP: The Costs of Omertà.” Rhodium Group. August 13, 2019. https://rhg.com/research/chinas-gdp-the-costs-of-omerta/.