

More Agreement, Less Certainty
by Mardoqueo Arteaga
TL;DR: In August 2026, the New York Fed’s headline measure of year-ahead inflation expectations held at 3.6%. Underneath it, households’ forecasts became more closely grouped while individual uncertainty increased (converging on mean, increase in variance). Agreement about a forecast and confidence in it are different pieces of information we should all take note of. Keeping both matters for decisions well beyond inflation.

Americans’ inflation forecasts moved closer together in August, even as their individual uncertainty widened. The New York Fed’s Survey of Consumer Expectations (SCE) put median year-ahead expected inflation at 3.6%, unchanged at the reported precision from July. My calculations from its public data show disagreement narrowing from 3.81 to 3.46 percentage points, while median individual uncertainty rose from 2.71 to 2.92 points. So, while the headline looked steady, the beliefs underneath it were moving in different directions. [1–3]
This was not uniform across time horizons. At the three year horizon, disagreement increased while uncertainty declined. At five years, both increased. Even within one survey, there was no single movement we could comfortably call “confidence,” which matters before we attach a story to the numbers. [1]
I used the SCE extensively in my dissertation, so returning to this data feels a bit of a homecoming (which fits the fall season). One of the survey’s most useful features is that it asks people to assign probabilities to different inflation outcomes. That lets us examine how much room for surprise sits around a forecast, alongside the forecast itself. It is a question I think deserves more space in how we discuss the economy.
Two kinds of spread
Disagreement in this context measures how far apart people’s expected inflation rates are. Here, we define it as the distance between the 25th and 75th percentiles across respondents. A smaller number means those forecasts are more closely grouped.
Uncertainty looks inside each person’s beliefs. The Fed fits a distribution to the probabilities each respondent assigns to possible outcomes, measures the width of its middle half, and reports the median of those individual widths. A larger number means that this measure of the range people consider plausible has widened. It does not measure whether they feel cheerful about the economy. [3]
The chart puts those two measures alongside each other. Both rose around the pandemic and during the subsequent inflation surge, so they can certainly move together. In the latest month, however, they separated. The longer history also shows why we should resist turning August’s increase in uncertainty into a claim that it is at a record high.
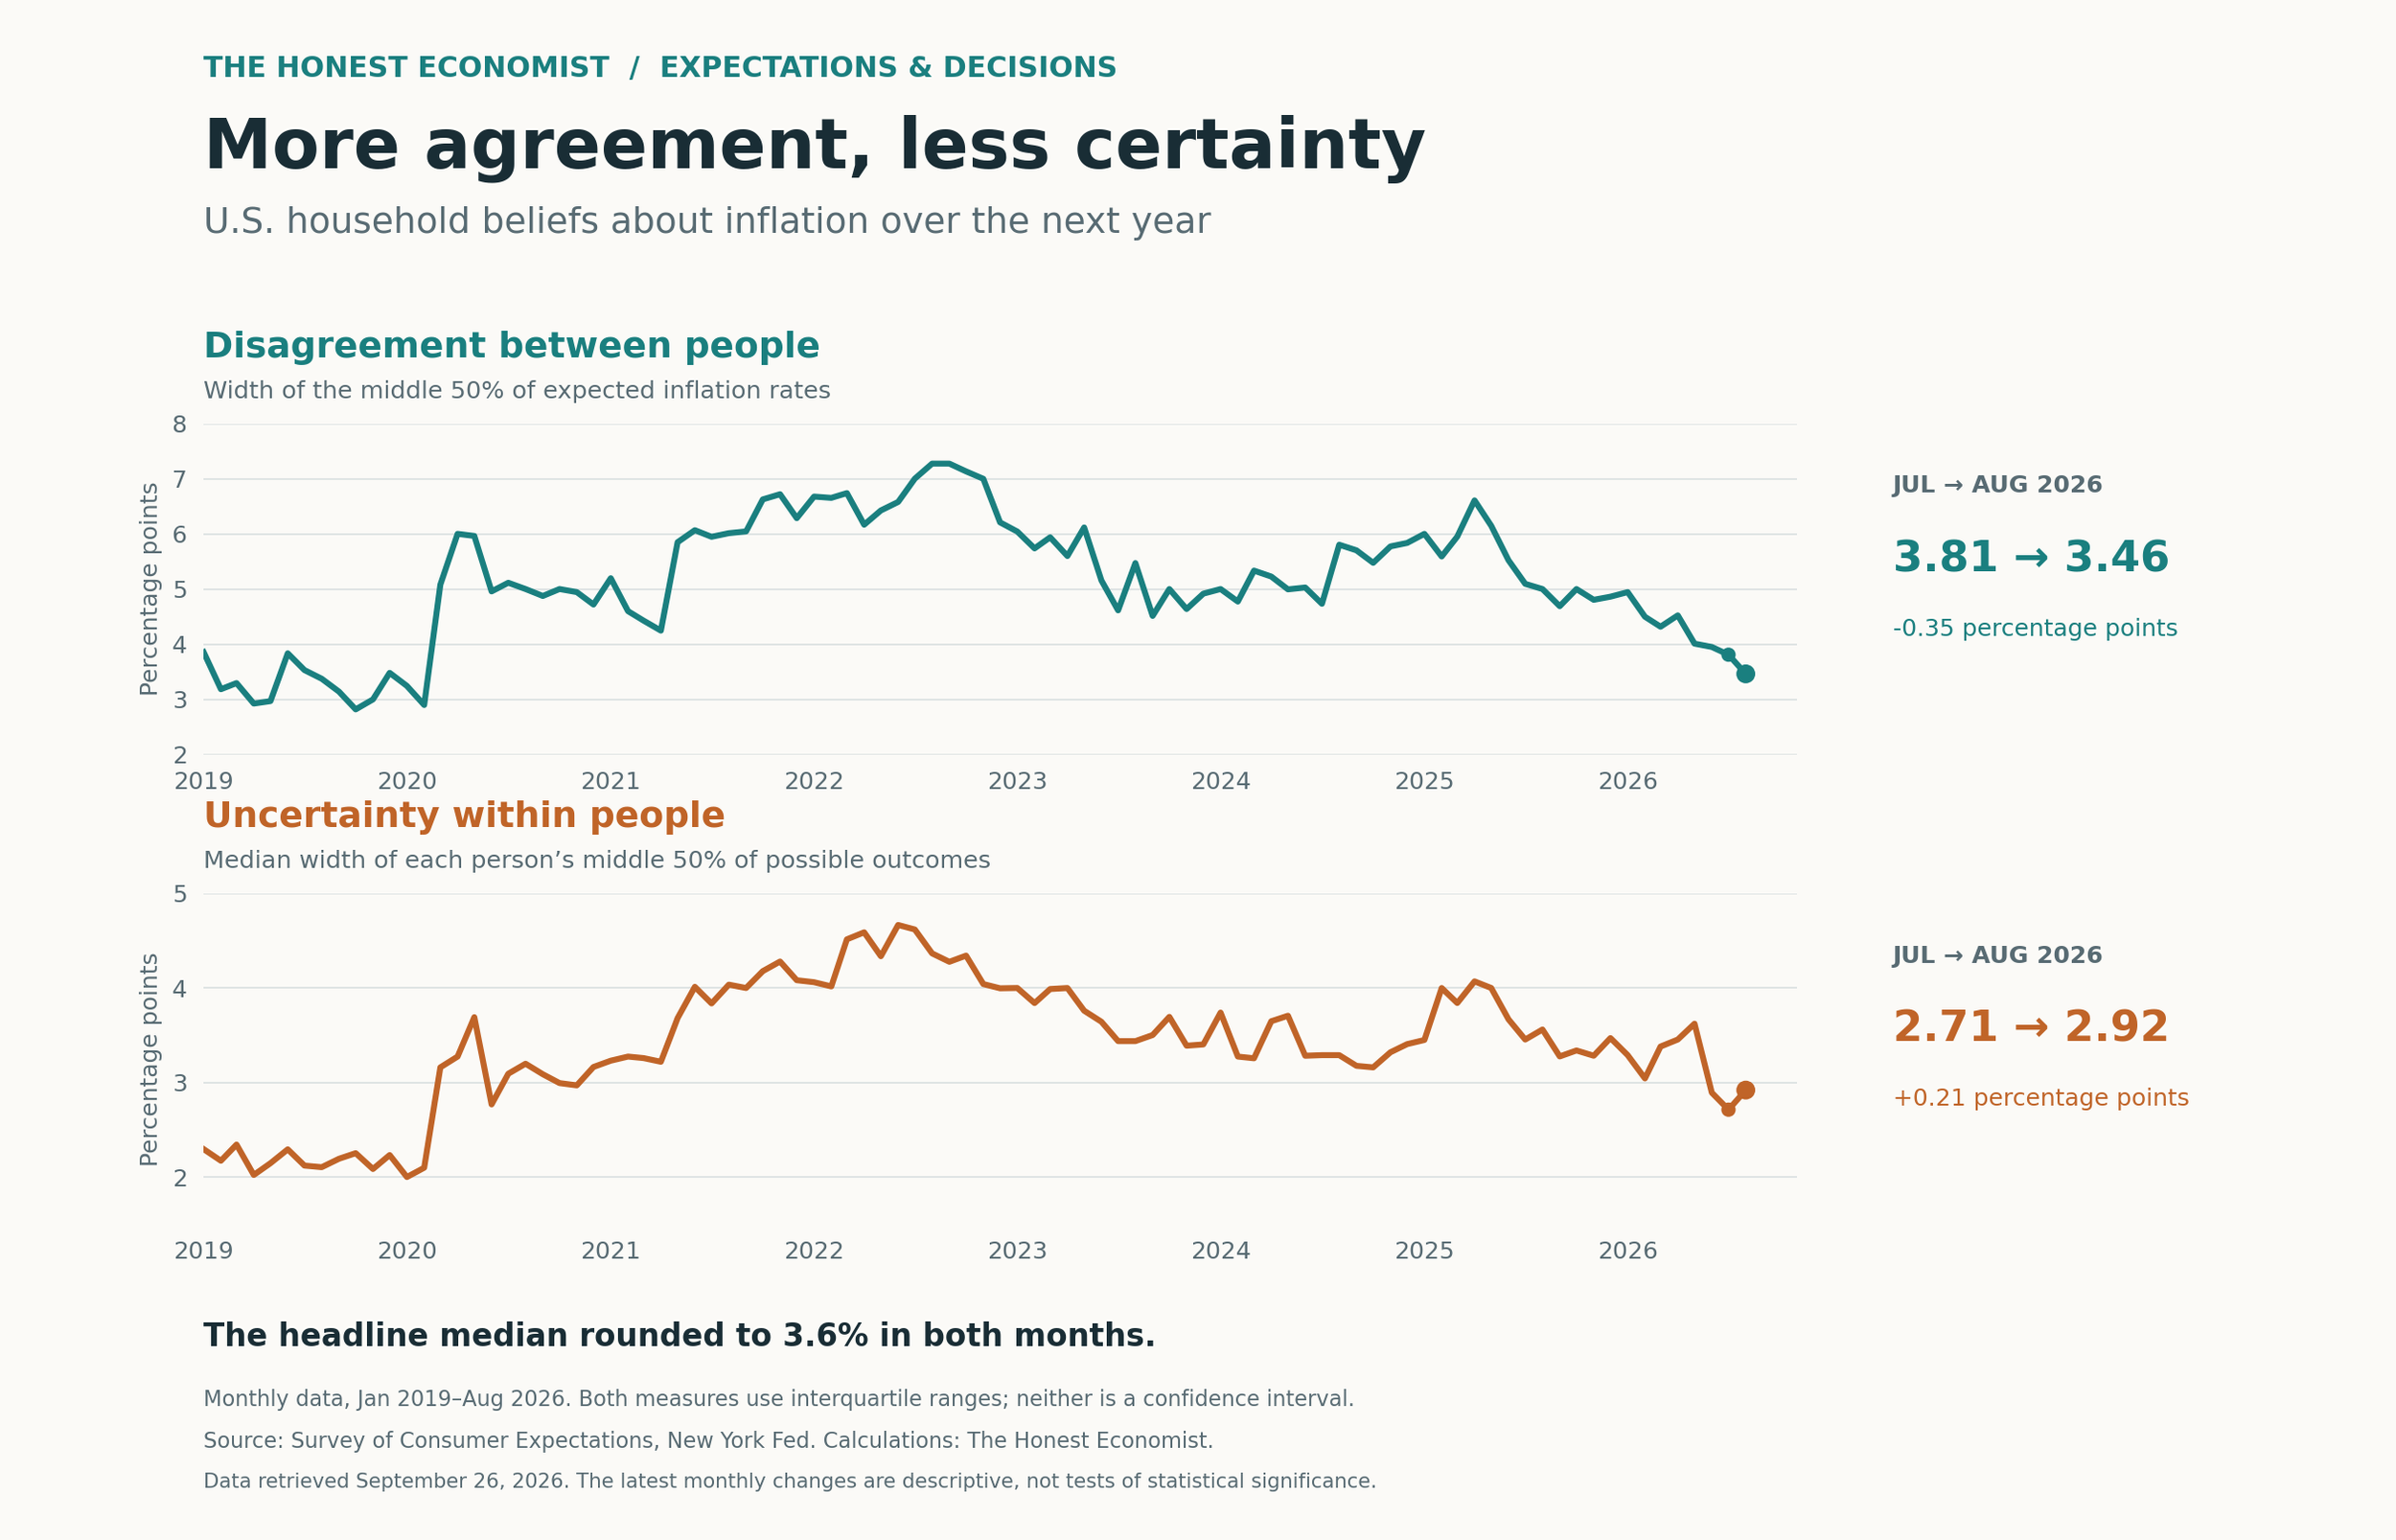
There is a useful restraint here to note and mentally log. These aggregate movements do not establish that the same people became both more aligned and more uncertain, or tell us what caused either change. They do show that a stable headline and narrower disagreement can coexist with greater measured uncertainty.
What a single number leaves out
The distinction I am emphasizing here has a long research history. The New York Fed has previously examined matched point and probability forecasts from professional forecasters and found mixed support for using disagreement as a proxy for uncertainty. Asking people where inflation will land and asking how widely it might vary provide different information. [4]
The mechanism is easiest to have a thought experiment on by thinking about what gets compressed. A probability distribution contains a range of outcomes and the weight assigned to each. Reducing it to one expected value removes that shape. Comparing everyone’s expected values cannot recover what each person left out.
For a more concrete example, two people can both expect 3% inflation while attaching very different probabilities to outcomes well above or below it. Their central estimates agree perfectly, while their willingness to make a commitment that becomes painful under high inflation could differ considerably. That example illustrates the distinction but it is not an estimate of how August’s respondents behaved.
This is where information economics connects to a very ordinary organizational practice: asking everyone to submit one number. Imagine how a revenue forecast can be indispensable for coordinating a budget. It can also conceal whether the team sees a reasonably narrow path ahead or several sharply different possibilities with the same average. A tidy spreadsheet has limited space for this distinction, though the business still has to live with it.
Agreement and the decision to act
The economic consequences depend on the decision. When an investment is costly to reverse and waiting allows more information to arrive, a wider range of possible outcomes can make delay more attractive, even if expected demand is unchanged. Prior work by Nicholas Bloom, Stephen Bond, and John Van Reenen develops this connection between uncertainty, partial irreversibility, and investment. [5]
That gives us a possible explanation for something that otherwise looks puzzling: people may agree on the outlook and still hesitate to act. The forecast alone does not tell us how much they stand to lose if the downside materializes, or whether they can change course afterward. Applying this logic to planning is an interpretation of the mechanism, not a finding about firms contained in the SCE.
In my previous post a few weeks ago, I asked what we would do differently if we knew the answer to another research question. This focus adds a complication; research might leave our central forecast almost untouched while reducing uncertainty enough to change the scale, timing, or reversibility of a commitment. Looking only for a revised headline number could miss its value.
For a planning discussion, I would want to hear the central forecast alongside the outcomes considered plausible, the evidence that would shift their probabilities, and the commitments that become uncomfortable under those outcomes. The useful detail between these pieces of information will depend entirely on the decision. Decisions between a small reversible experiment and a long lease do not require the same degree of certainty.
August’s survey offers a modest but useful observation: forecasts can move closer together while the people making them leave more room for surprise. We should be able to carry both facts into the conversation. Once everyone has supplied their number, there is still something worth asking about the range around it.
Works Cited:
[1] Federal Reserve Bank of New York. “Medium-Term Inflation Expectations Tick Down; Unemployment Expectations Deteriorate.” August 2026 SCE release, published in September 2026.
[2] Federal Reserve Bank of New York. Survey of Consumer Expectations: downloadable chart data. “Inflation expectations” and “Inflation uncertainty” worksheets; author’s calculations.
[3] Federal Reserve Bank of New York. Interactive Chart Guide for the Survey of Consumer Expectations, inflation expectations and inflation uncertainty definitions.
[4] Rich, Robert, and Joseph Tracy. “The Relationships among Expected Inflation, Disagreement, and Uncertainty: Evidence from Matched Point and Density Forecasts.” Review of Economics and Statistics 92(1), 2010, pp. 200–207. Earlier working paper available from the New York Fed.
[5] Bloom, Nick, Stephen Bond, and John Van Reenen. “Uncertainty and Investment Dynamics.” NBER Working Paper 12383, 2006.
Source: Survey of Consumer Expectations, © 2013–2026 Federal Reserve Bank of New York (FRBNY). The SCE data are available without charge at http://www.newyorkfed.org/microeconomics/sce and may be used subject to license terms posted there. FRBNY disclaims any responsibility or legal liability for this analysis and interpretation of Survey of Consumer Expectations data