

Who Really Feels the Downturn? Rethinking “Recession” from the Ground Up
by Kent O. Bhupathi
In the fall of 2008, I was a high school student. By all outward appearances, life should have felt simple: class schedules, teenage distractions, college brochures arriving in the mail. But I remember a different sensation. A slow, quiet panic crept into conversations at the dinner table. Classmates who used to brag about new video games or summer plans began whispering about their parents losing jobs. Distant cousins moved back in with grandparents. And even in my young, largely insulated world, I could feel the walls of certainty shaking.

No single headline explained it all.
The stock market was tanking, yes. But why did my friend’s dad, who worked in construction, suddenly have no contracts? Why was a well-off neighbor selling their second car? The official term—"recession"—was tossed around by adults and pundits as if it carried an air of clinical finality. But what I saw looked far messier: bursts of pain blooming unpredictably across homes and neighborhoods.
That early dissonance sparked a lifelong obsession. And it led me to a central conviction: a recession isn’t a singular truth. It’s a mosaic of impacts. Its definition should serve clarity, not confusion or fear.
The Problem With "Recession"
Let’s start with a hard truth: there is no universally accepted definition of a recession. None. And yet we treat the concept around it as though it were gospel. We nod solemnly when we hear, "we're entering a recession," without asking: according to whom, and based on what? The consequence is a word that feels authoritative but functions more like a foghorn: loud, alarming, and, frankly, difficult to triangulate.
To understand how we got here, we should first review the major definitions in use today.
The NBER's Broad-Based Decline
The National Bureau of Economic Research (NBER) defines a recession as a "significant decline in economic activity spread across the economy, lasting more than a few months," typically visible in indicators like production, employment, real income, and sales. It’s comprehensive and historically accurate. It has not missed or falsely declared a recession.
Yet this definition is retrospective and requires human judgment. The 2007 recession, for instance, wasn't officially recognized until a year later, which limits its usefulness for policy and planning.
The Two-Quarter GDP Rule
A simpler, more accessible rule (that continues to plague high schools and colleges) says that two consecutive quarters of GDP decline equal a recession. Though easy to understand, this rule failed to identify the 2001 recession and gave a misleading signal in 2022 when GDP declined modestly but employment and consumption remained strong.
The Sahm Rule (Unemployment Spike)
This rule flags a recession when the 3-month average unemployment rate rises by at least 0.5 percentage points from its prior 12-month low. It’s been useful as a timely confirmation tool, but it is a lagging indicator by design. This means that it often catches downturns already underway and may miss recessions driven by declines in income, hours, or productivity that don't immediately show up in job losses.
Other definitions, like Hamilton's GDP filter or the OECD’s output gap approach, add even more variety and complexity. The result? A tangle of metrics that confuse more than they clarify—and in public discourse, that confusion can turn into anxiety.
Theoretical Foundations and Predictive Challenges
Economists do not agree on a single cause of recessions, yet several well‑tested ideas help us understand the main fault lines. The Keynesian view links downturns to sudden drops in spending, such as tighter monetary policy, sliding consumer confidence or sharp cuts in public budgets. Real Business Cycle research highlights supply problems, such as oil shocks or faltering productivity, which raise costs and slow output. A third strand, rooted in Hyman Minsky’s work, focuses on long credit booms. Easy borrowing can inflate asset prices; when the bubble bursts and banks pull back, a credit squeeze follows and growth stalls. Each lens explains part of the story, but none is complete on its own.
However, knowing why recessions start is different from knowing when they will start.
Headline measures such as real GDP and aggregate income often confirm trouble only after it has begun. Faster‑moving gauges include employment growth, income excluding government transfers, industrial production, consumer sentiment and new claims for unemployment benefits; these series tend to turn earlier. Financial markets can be more prescient still. An inverted yield curve, measured by the gap between three‑month and ten‑year United States Treasury rates, has preceded every American recession since the 1970s with very few false alarms. Composite barometers such as the Conference Board’s Leading Economic Index strengthen the signal because they combine many clues in one score.
Even so, forecasting remains fraught. Initial data get revised, the economy’s structure evolves and shocks today are transmitted through channels that looked different decades ago. The most reliable approach therefore blends theory with a wide set of timely indicators and accepts that any warning system will sometimes misfire.
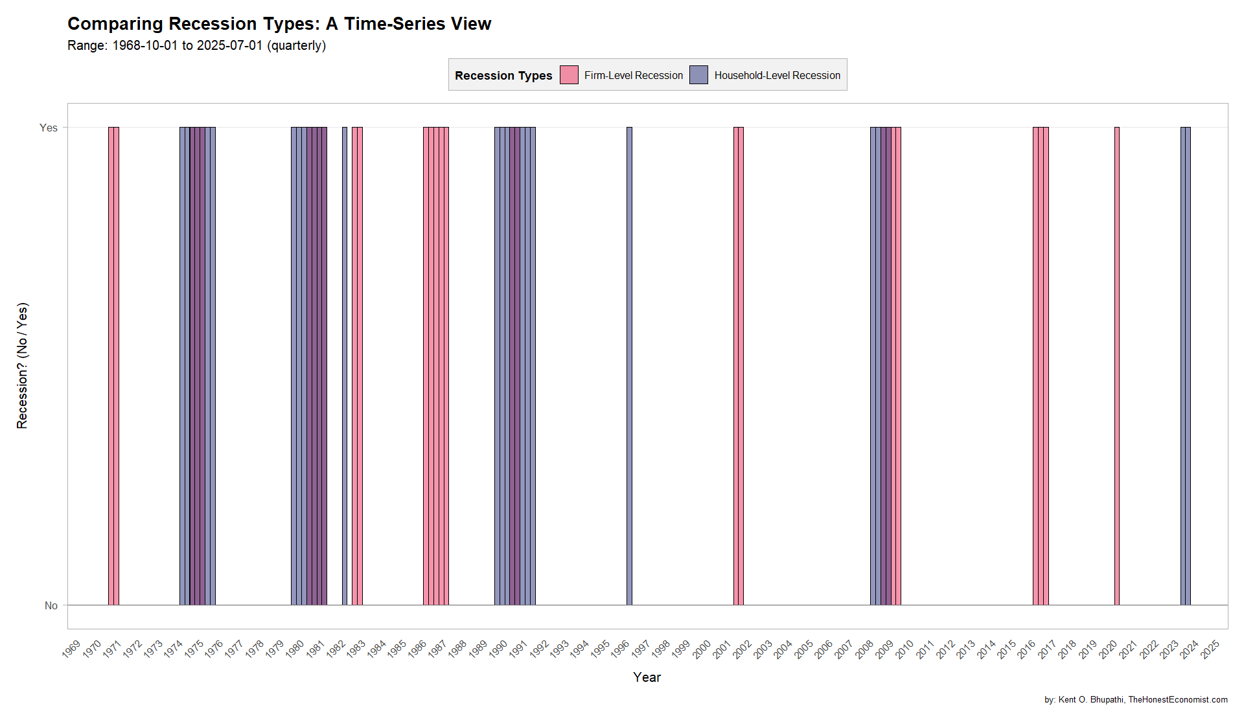
This visualization applies a custom recession definition that distinguish between firm-level and household-level downturns, offering a more detailed categorization than conventional benchmarks. It reveals a higher frequency of economic distress, aligning with but also extending beyond official NBER designations by showing which parts of the economy were most impacted during each period.
Introducing a Transparent, Sector-Sensitive Framework
In response to these gaps, I developed a recession classification system that emphasizes clarity and context.
Instead of treating the economy as a single unified engine, my model breaks it down into two core engines: firms and households. Each can exhibit recessionary stress independently or in tandem.
The framework tracks four key indicators from the Federal Reserve’s data system: compensation per employee, continued unemployment claims, worker productivity, and private investment. These are adjusted for inflation and labor force shifts, then smoothed using one- and two-year rolling averages to highlight real, sustained changes. In plain terms, it’s just tracking how people and businesses earn, lose, and invest—then filtering out the noise to catch real signs of trouble.
Building on those four pillars, the system applies straightforward rules to flag when either the household or firm side of the economy has entered recession territory. It’s less about forecasting and more about recognizing when conditions have already crossed a meaningful threshold.
Lastly, the framework includes "sensitivity flags," which act like yellow lights—signals of emerging stress before a full recession hits. These early markers help households and businesses spot turning points before the headlines do.
By using a subset of well-established, transparent inputs and sector-level granularity, the model becomes both diagnostic and directional. It doesn’t just say "recession or not." It also asks: who is hurting?
At the time of this publication, the United States is not in a full household or firm-level recession. However, rising unemployment signals growing household strain.
An Honest Economist Recession Forecasting tool is on the way—stay tuned for updates!
Why Recession Should Be Personal
Here’s the truth: downturns don’t arrive with a uniform stamp. They vary by geography, sector, and household. Some people lose jobs; others find opportunity. One industry contracts while another expands.
This variability was obvious in 2008. Homebuilders collapsed, but bankruptcy lawyers were in demand. The energy sector might be reeling while tech surges ahead. Your neighbor’s experience might look nothing like your own.
So why do we cling to one-size-fits-all definitions? Instead, recession literacy should focus on self-awareness. Are your savings adequate? Is demand dropping in your industry? Are clients hesitating?
This is not just about data. It’s about agency.
When "recession" becomes a catch-all for fear, it turns into a bogeyman—a vague, looming threat that paralyzes action. But the better we define and personalize recession, the more we can respond with nuance and resolve. We stop waiting for an official declaration to tell us how to feel. We start making informed, measured decisions based on the indicators that matter to us.
Understanding the complexity behind recessions doesn’t have to breed fear. It can lead to empowerment. Preparation beats panic. Precision beats mythology.
Conclusion: A Call for Economic Self-Awareness
Economics is the study of human behavior under constraints and uncertainty. Recessions offer a surplus of both. They deserve better definitions: ones that are timely, transparent, and tailored.
Rather than asking "Are we in a recession?" we should be asking: "What are the signals in my world?" The best recession framework is the one that helps you act, not panic.
It is high time to retire the foghorn and replace it with a compass.
Sources:
Benzoni, Luca, Olena Chyruk, and David Kelley. “Why Does the Yield-Curve Slope Predict Recessions?” Chicago Fed Letter, no. 404 (2018). https://www.chicagofed.org/publications/chicago-fed-letter/2018/404.
Brookings Institution. “How Will We Know When a Recession Is Coming?” Brookings, September 6, 2018. https://www.brookings.edu/articles/how-will-we-know-when-a-recession-is-coming/.
The Conference Board. Leading Economic Indicators and the Oncoming Recession. December 7, 2022. https://www.conference-board.org/publications/pdf/index.cfm?brandingURL=Leading-Indicators-Recession.
International Monetary Fund. “What Is a Recession?” Finance & Development, September 9, 2022. https://www.imf.org/external/pubs/ft/fandd/basics/recess.htm.
Kelley, David. “Which Leading Indicators Have Done Better at Signaling Past Recessions?” Chicago Fed Letter, no. 425 (2019). https://www.chicagofed.org/publications/chicago-fed-letter/2019/425.
Leamer, Edward E. What's a Recession, Anyway? NBER Working Paper No. 14221. Cambridge, MA: National Bureau of Economic Research, August 2008. https://www.nber.org/system/files/working_papers/w14221/w14221.pdf.
National Bureau of Economic Research. “Business Cycle Dating Procedure: Frequently Asked Questions.” Revised September 23, 2024. https://www.nber.org/research/business-cycle-dating/business-cycle-dating-procedure-frequently-asked-questions.
Owyang, Michael T. “Making Sense of Recession Probabilities.” On the Economy (blog), Federal Reserve Bank of St. Louis, May 27, 2025. https://www.stlouisfed.org/on-the-economy/2025/may/making-sense-recession-probabilities.
Sumner, Scott. “The ‘Two Negative Quarters’ Myth.” Econlib, July 3, 2022. https://www.econlib.org/the-two-negative-quarters-myth/.