

The Borrowers Who Never Ask
by Mardoqueo Arteaga
TL;DR: In the New York Fed’s latest credit-access survey, 5.2% of respondents had not applied because they expected rejection. Their absence matters when interpreting demand: the activity we observe reflects both what people want and whether they believe pursuing it is worthwhile.

In June 2026, 5.2% of respondents to the New York Fed’s credit-access survey reported not applying because they expected rejection, down from 8.3% in February. Among those who did apply, 16.1% reported at least one rejection, compared with 15.9% in the previous wave. Fewer people reported staying out, while rejection among applicants changed little. The measures capture different decisions, and both matter for understanding participation in a market. [1, 2]
This remains the latest published wave of the Credit Access module as of October 18; it runs every four months. The monthly SCE offers a more recent signal: its October 7 release reported worsening perceptions of credit availability in September. That tells us something about how households see the market now, while the detailed module lets us examine the decision to enter it. The two surveys measure different things. [1, 3]
The broader implication reaches well beyond borrowing. A business sees the inquiries it receives and the customers it serves. Before either appears in a report, someone has decided that approaching the business is worth the effort. Expectations about price, eligibility or the likelihood of a response help shape that decision. Observed demand therefore carries information about both people’s needs and their beliefs about whether those needs can be met.
Demand begins before the application
The credit survey makes part of this otherwise quiet process visible. It asks about applications over the preceding twelve months and identifies people who applied for none of the covered products because they expected rejection. These respondents would be absent from a record of submitted applications, even though their decisions tell us something about participation. [4]
The rejection rate describes a different population: applicants who experienced at least one fully rejected application. Some may also have obtained credit elsewhere. The two percentages have different denominators and cannot be added into a single exclusion rate. Together, however, they let us distinguish what happened after people applied from a reason others never reached that stage. [4]
The chart follows those two measures over time. Its latest observations show a decline in discouragement alongside little change in rejection among applicants. That is a more informative account of participation than either series supplies on its own.
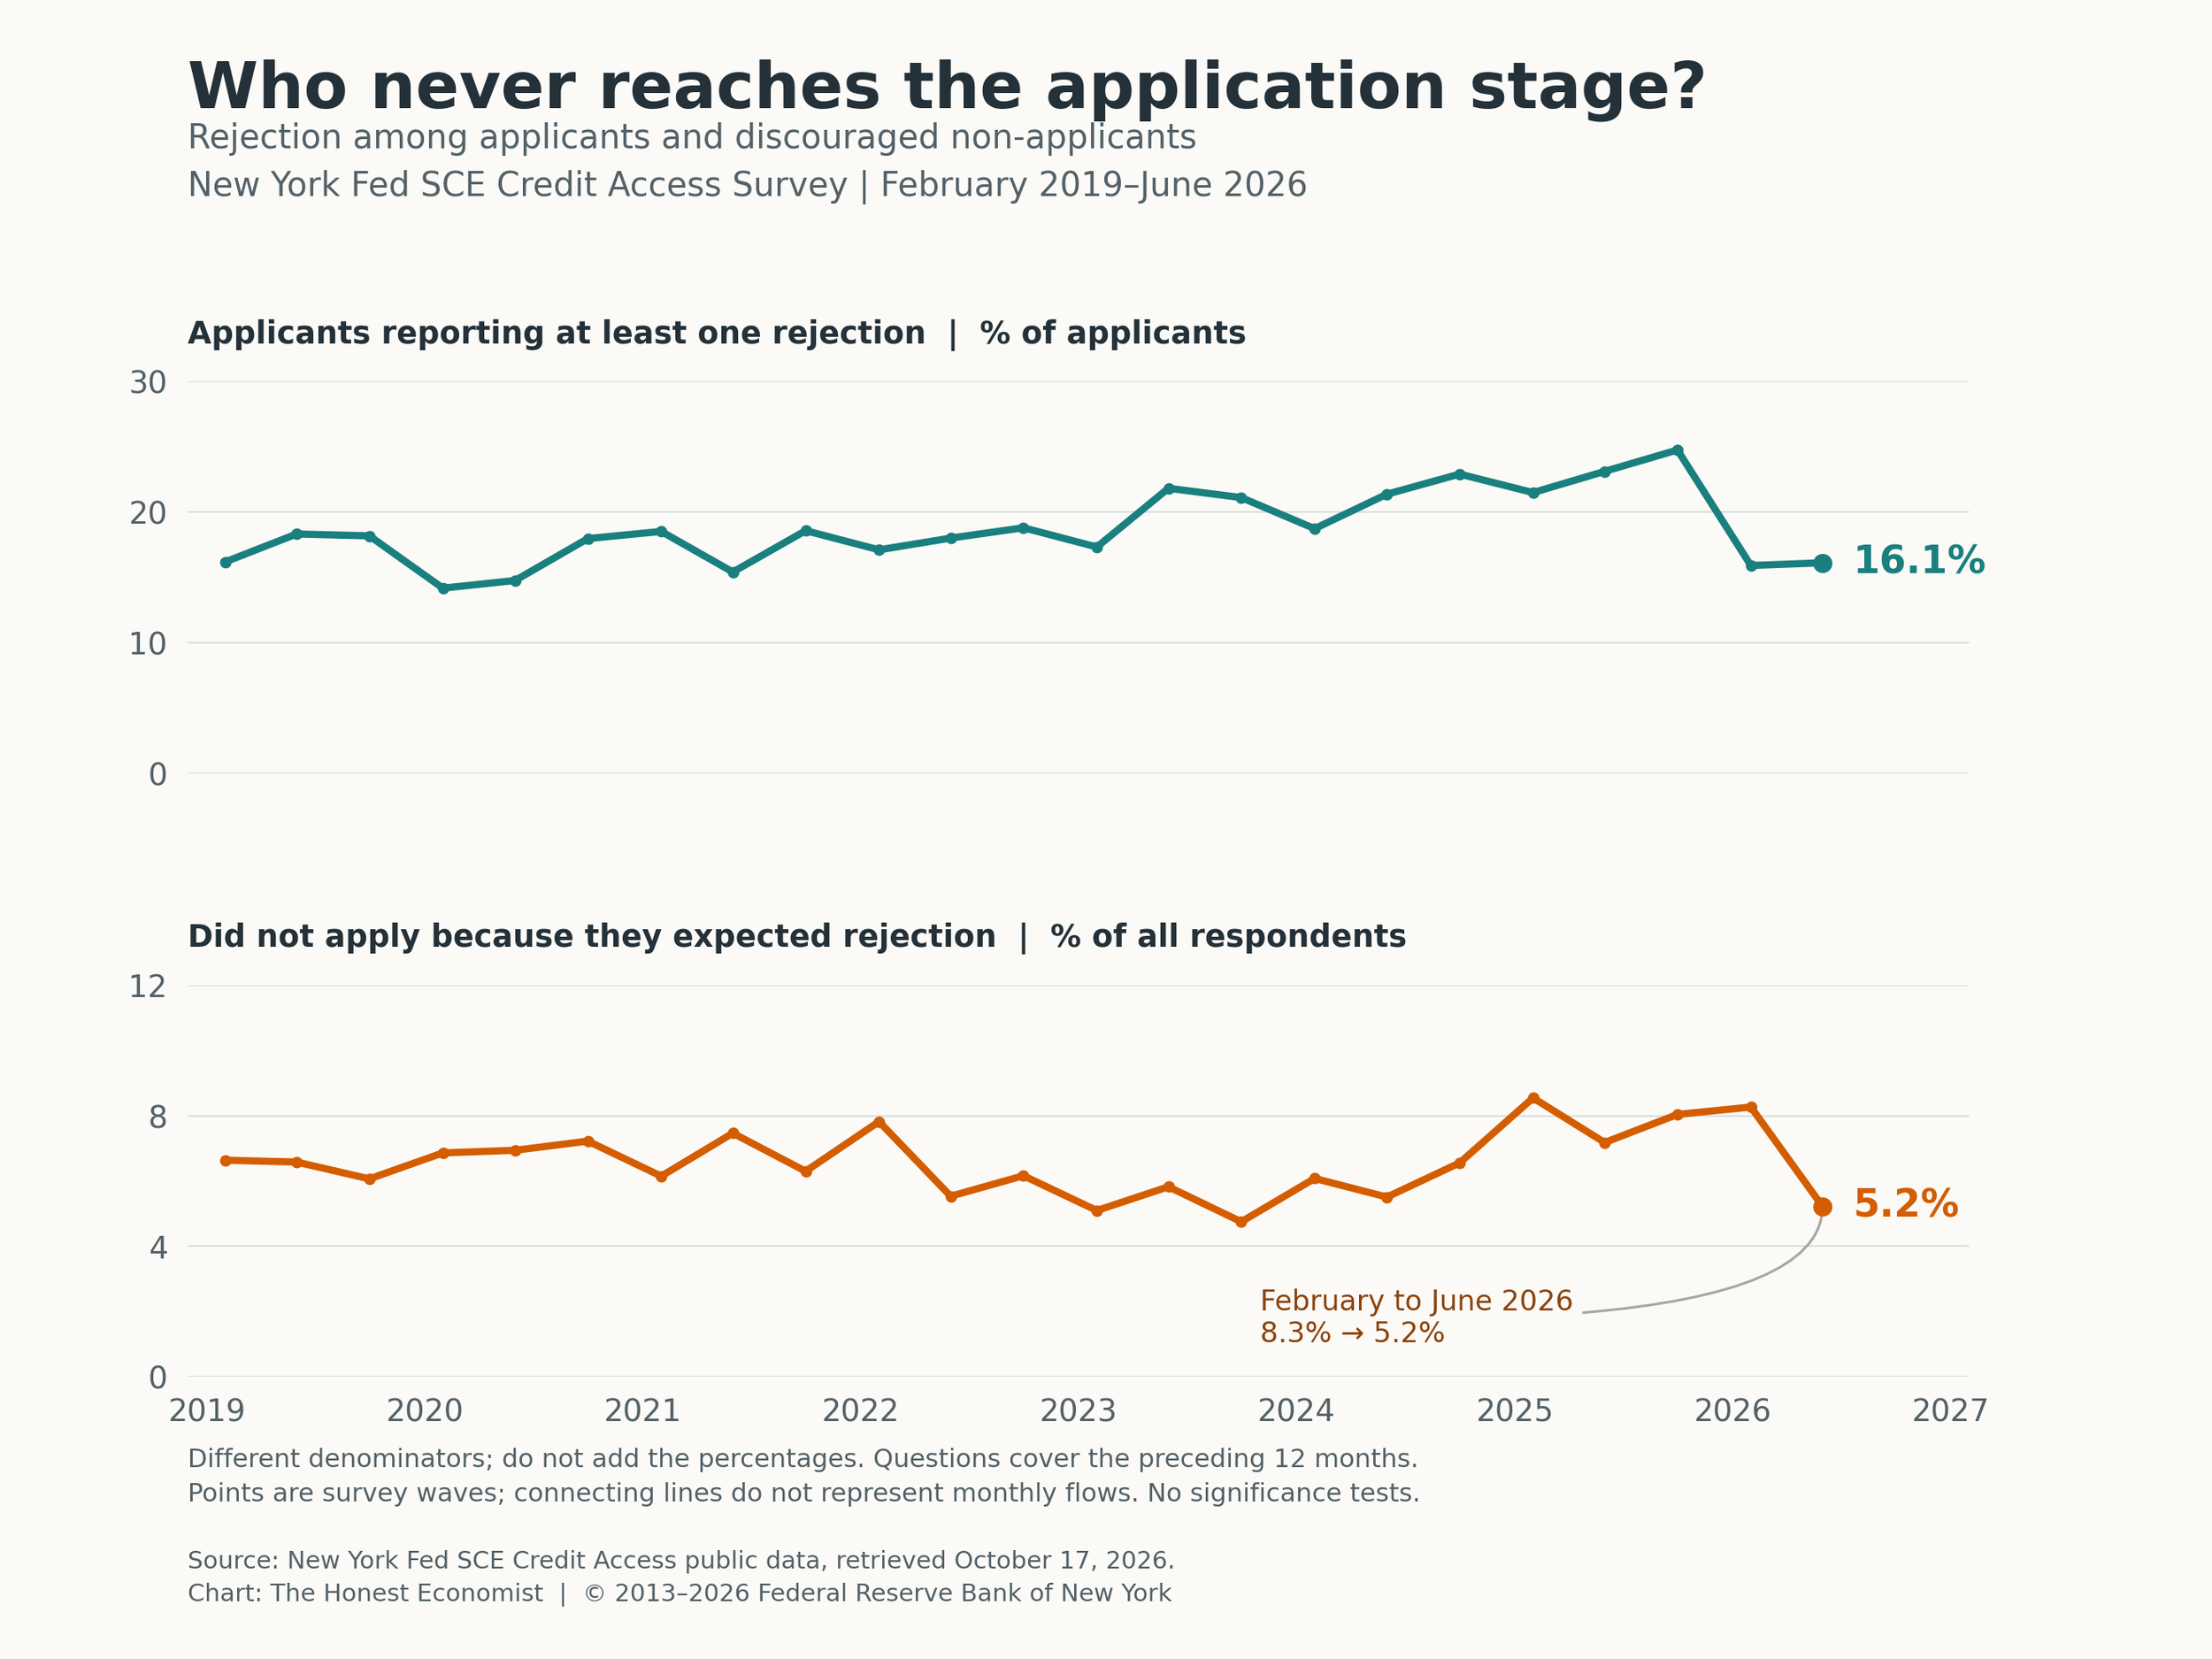
Figure: Rejection among applicants edged up between February and June 2026, while discouraged non-application fell. Survey waves from February 2019 through June 2026; percentages with different denominators. Questions concern the preceding twelve months. Lines connect observed waves, not monthly flows. Changes are descriptive, without significance tests. Source: New York Fed SCE Credit Access Survey; calculations and chart by The Honest Economist.
Beliefs change the sample
Economists call this a selection problem. The outcomes available to study depend on who participates, and participation is itself an economic decision. James Heckman’s work established why relationships estimated from selected samples may not describe the broader population. In this case, beliefs about obtaining credit help determine whose experience enters the applicant statistics. [5]
The mechanism works through the expected value of trying. Applying takes time and effort, and the benefit depends partly on the chance of success. A person who expects rejection may reasonably decide to stop before completing the paperwork. Their need for credit can remain even when their willingness to apply disappears.
This can change how we interpret an apparently improving market. If applicants with weaker credit profiles become more discouraged, the remaining pool could look stronger without lenders changing their standards. Conversely, the return of previously discouraged applicants could raise rejection rates as participation expands. These are possible mechanisms, not explanations established by the chart. The aggregate data do not tell us who changed their behavior or whether non-applicants would have been approved.
Expectations may also be accurate. Some households correctly anticipate that a lender will turn them down; others may underestimate their chances. The distinction matters because providing clearer information and changing lending conditions address different problems.
What interests me is how easily that distinction disappears when we begin our analysis with the people who showed up. A precise account of their experience can still leave us with an incomplete understanding of demand.
The customer who never requests a quote
Consider a business offering home repairs. Its records show quote requests, quoted prices and the share of quotes that become jobs. Those are useful measures of the customers it reaches. Now consider a homeowner who needs a repair but assumes the service will be too expensive and never asks for a quote. This is an illustration of the mechanism, rather than a result from the credit survey.
The business sees no inquiry. Yet that absence could reflect several different circumstances: the homeowner cannot afford the actual price, overestimates it, or does not consider the repair worth doing. Those explanations have different implications. Publishing an indicative price range could help someone with a mistaken expectation decide whether to inquire. It would do little for someone whose budget genuinely falls short. Silence alone does not identify which problem the business faces.
This also changes what additional research is worth collecting. Interviewing more customers who requested quotes may improve our understanding of conversion, while leaving the earlier decision largely unexplored. Reaching people who considered the service but never contacted the provider could reveal whether expectations about cost or the process influenced their choice. Their answers would offer evidence about perceived barriers, rather than a count of guaranteed future customers.
There is a precedent for asking beyond observed transactions. In their research on the pandemic, the New York Fed’s Jessica Lu and Wilbert van der Klaauw examined discouraged borrowing alongside questions about willingness to apply if acceptance were guaranteed. That approach helps distinguish interest in credit from expectations about access. Its value here is methodological: it asks what might change a participation decision. [6]
For a business trying to understand its market, I would bring that question into the discussion early. What did people expect before they approached us, and what led others to stay away? The credit data remind us that demand becomes visible through choices about participation. Understanding those choices can help explain why a market looks the way it does, and where better information might make a difference.
Works Cited:
Source attribution: Survey of Consumer Expectations, © 2013–2026 Federal Reserve Bank of New York (FRBNY). Data are available without charge subject to the posted license terms. FRBNY disclaims responsibility or legal liability for this analysis and interpretation.